Non-Point Source Priority Dashboard
The Non-Point Source Priority Dashboard (NPSPD) was developed to assist the Colorado Department of Public Health and Environment (CDPHE) prioritize watersheds for conservation, restoration, and preservation.
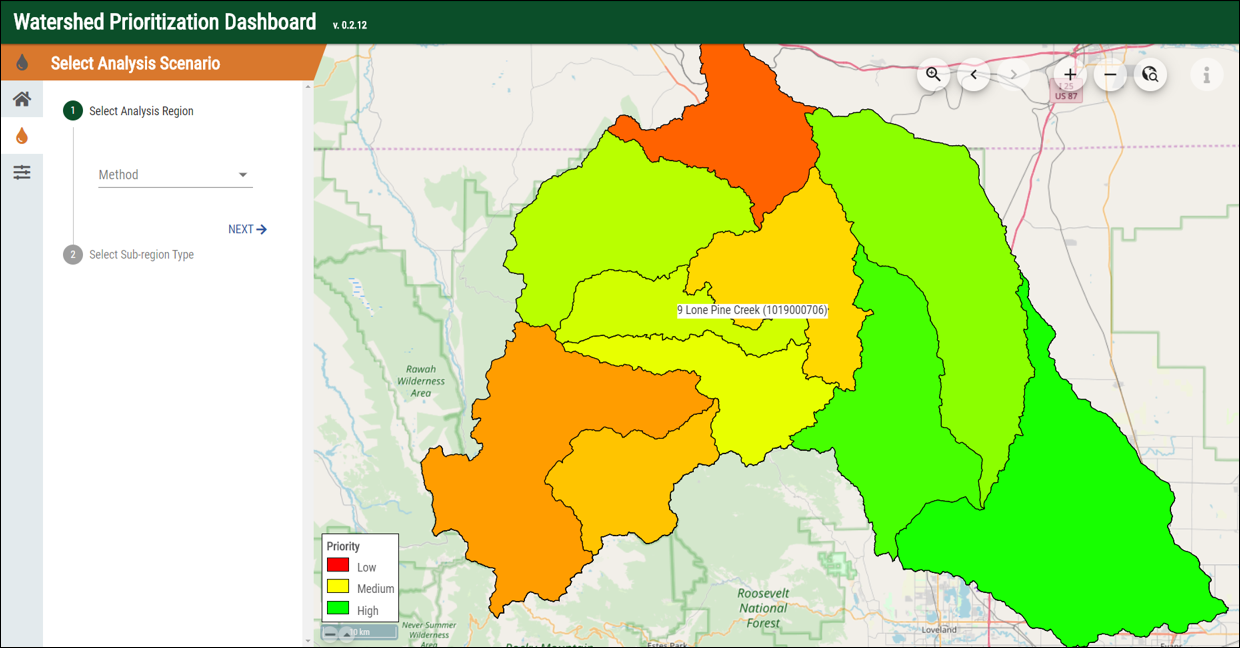
The dashboard enables users to explore physiographic and ecohydrological conditions across Colorado and prioritize watersheds based on specific restoration or protection criteria. The tool uses a Multi-Criteria Decision Analysis (MCDA) approach to assist with decision making by allowing users to build customized scenarios and identify priority watersheds in a region.
Specifically, the tool provides predefined information for prioritization using the U.S. Environmental Protection Agency (EPA) Healthy Watersheds Assessment metrics as well as user defined metrics for restoration or prevention prioritization.
Users can customize the level of importance and either maximize or minimize the significance of numerous assessment criteria ranging from landscape and biological condition to water quality and contamination, as well as land use and climate change. Multiple analyses can be conducted and compared within the dashboard. Results and raw data can be exported as a spreadsheet and the interactive graphing features help visualize the model outputs.
Application
- Conduct EPA healthy watershed assessment.
- Rank watersheds for their protection and/or restoration needs.
- Build customized analysis scenarios.
- Identify critical watersheds in a region.
- Compare assessment criteria across watersheds.
Resources