R2Cross
The R2Cross Program was created to assist Colorado Water Conservation Board (CWCB) watershed managers in determining instream flow recommendations for maintaining minimum flows between specific points on a stream or levels in natural lakes to preserve or improve the natural environment.
Standardized field and office procedures help to ensure that instream flow recommendations reflect the amount of water required to preserve and improve the natural environment.
Method
The R2Cross method is one of the standard techniques employed by state and federal agencies to model instream hydraulic parameters and develop instream flow recommendations in Colorado.The R2Cross method is based on a hydraulic model and uses field data collected in a stream riffle. Riffles are most easily visualized as the stream habitat types that would dry up first should streamflow cease.
Data
The required field data includes streamflow measurements, surveys of channel geometry at a transect, and of the longitudinal slope of the water surface, and pebble counts to determine the grainsize distribution.
The field data is used to model three hydraulic parameters: average depth, average velocity, and percent wetted perimeter. Recommendations are then based in meeting a combination of hydraulic habitat criteria (depth, velocity, percent wetted perimeter).
Components
The R2Cross program includes four main components:
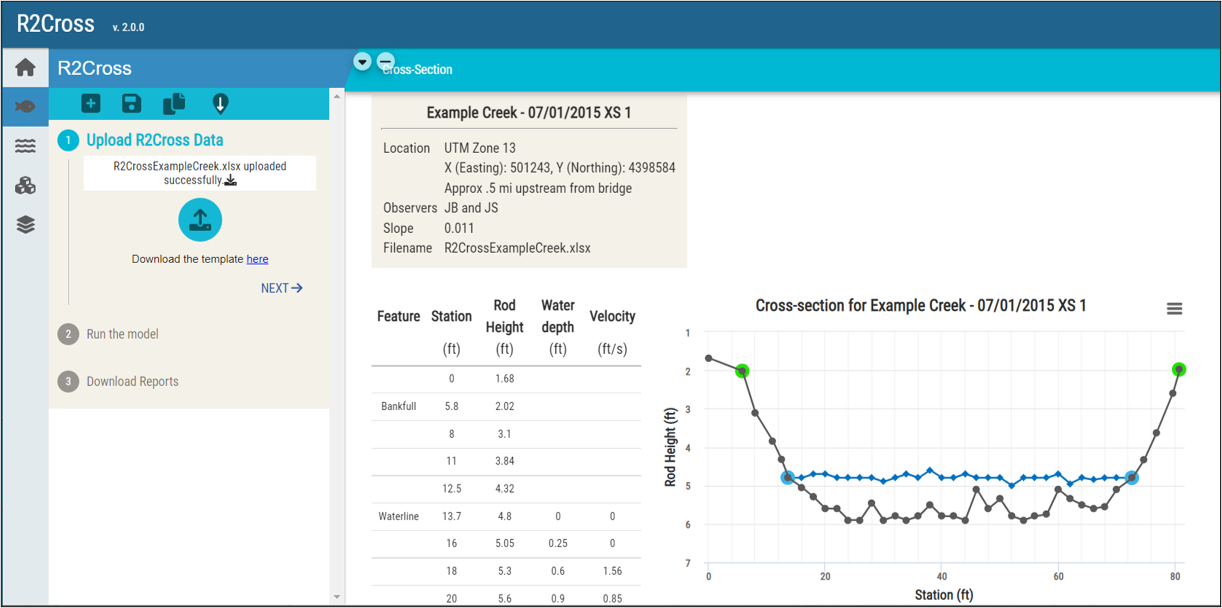
- R2Cross Tool can be used to determine instream flows based on field measurements input by the user.
- Discharge Calculator a stand-alone component that can be used to determine the discharge at a cross-section other than the one used in R2Cross.
- Particle Size Calculator a stand-alone component that can be used to determine statistical distributions of sediment sizes based on size classifications.
- Geographic Interface includes data layers and mapping tools to locate the cross-section and display information related to hydrography, stream gages, water right structures and other coverages.
Results
The R2Cross Program graphically summarizes user supplied data to assist Colorado Water Conservation Board (CWCB) watershed managers and decision makers determine instream flow recommendations. The program itself does not provide the recommendations, rather it summarizes the model outputs into the following categories:
- Staging Table – provides a table of hydraulic variables for incremental stream stages
- R2Cross Summary – compares measured (field data) and model calculated values
- Supplmentary Results – displays (1) measured data collected in the field; and (2) accompanying hydraulic variables calculated using the field surveyed data
- Habitat Criteria Results – contains a summary table of the three biological flow criteria and three dynamic graphs showing the relationship between these criteria and discharge
- Discharge Results – displays the results of the Discharge Calculator
- Pebble Count Results – displays the results of the Particle Size Calculator
All results can be exported as a PDF or Excel file. Additionally, histograms and graphs can be exported invidually as png or jpg files to create customized reports and materials.