U.S. Urban and Climate Change Assessment
Authors
- Matei Georgescu – Arizona State University
- Scott Krayenhoff – University of Guelph
Purpose
The principal drivers of urban heat – climate change and urban development – may or may not dynamically interact to lessen or exacerbate projections of warming in cities. The data from this project (A2-2) provides comprehensive diurnal scale assessment of separate and joint effects of urban expansion and greenhouse gas emission impacts on end of century CONUS hydroclimate, while also examining the efficacy and potential tradeoffs associated with various adaptation and mitigation strategies (e.g., street level tree deployment). Additional project details are available here.
Citation: Krayenhoff, E. S., Moustaoui, M., Broadbent, A. M., Gupta, V., and Georgescu, M (2018). Diurnal interaction between urban expansion, climate change and adaptation in 21st century U.S. cities, Nature Climate Change, 8: 1097–1103. DOI: 10.1038/s41558-018-0320-9.
Description
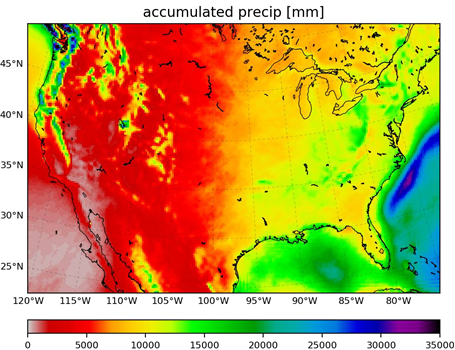
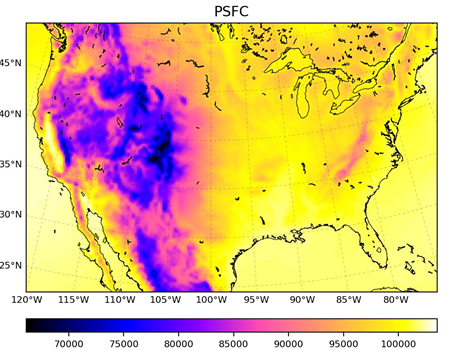
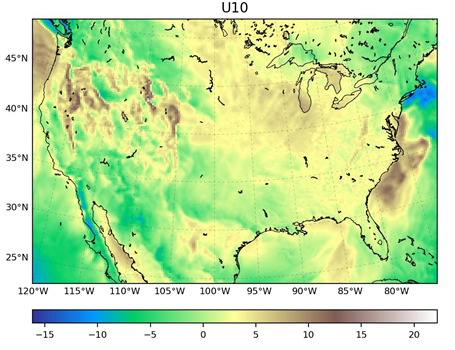
We combine decadal-scale regional climate modeling simulations across the continental US (CONUS) with the Weather Research and Forecasting (WRF) system with urban expansion scenarios derived from the EPA Integrated Climate and Land-Use Scenarios (ICLUS) data set to examine end of century (2090-2099) hydroclimate impacts. Decadal scale simulation output is available for the CONUS at three-hour frequency, facilitating analysis across the diurnal cycle for end of century (2090-2099) relative to start of the century (2000-2009) climate.
Scenarios
WRF is applied for multiple scenarios at the beginning (2000-2009) and end (2090-2099) of the 21st century, and is dynamically downscaled using the Geophysical Fluid Dynamics Laboratory (GFDL) and Community Earth System Model (CESM) global climate models for both Representative Concentration Pathways (RCP) 4.5 and 8.5 to characterize end of century climate. The potential to reduce warming associated with these twin drivers of urban climate change is examined via additional simulations incorporating a suite of heat mitigation strategies ranging from cool and green roofs, to modification of engineered materials, and finally to street-level tree deployment.
Current Land Use:
- 2000-2009 Climate (ERA Interim) + 2010 Urban Land Use
- 2090-2099 Climate (CESM RCP8.5) + 2010 Urban Land Use
- 2090-2099 Climate (GFDL RCP8.5) + 2010 Urban Land Use
Future Land Use:
- 2090-2099 Climate (CESM RCP8.5) + 2100 Urban Land Use
- 2000-2009 Climate (ERA Interim) + 2100 Urban Land Use
- 2090-2099 Climate (GFDL RCP8.5) + 2100 Urban Land Use
- 2090-2099 Climate (CESM RCP4.5) + 2100 Urban Land Use
- 2090-2099 Climate (CESM RCP8.5) + 2100 Urban Land Use + Cool roof
- 2090-2099 Climate (CESM RCP8.5) + 2100 Urban Land Use + Evaporative roof
- 2090-2099 Climate (CESM RCP8.5) + 2100 Urban Land Use + Street tree
- 2090-2099 Climate (CESM RCP8.5) + 2100 Urban Land Use + Low thermal admittance
- 2090-2099 Climate (CESM RCP8.5) + 2100 Urban Land Use + Cool / Evaporative roof + Street tree
- 2090-2099 Climate (CESM RCP4.5) + 2100 Urban Land Use + Cool / Evaporative roof + Street tree
Attributes
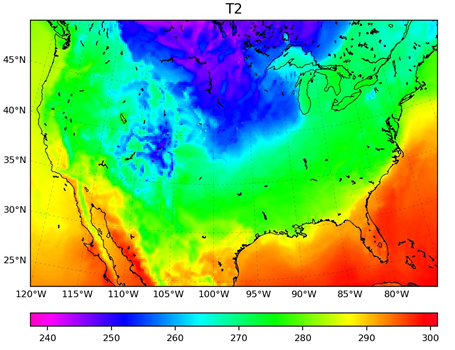
- T2: Diagnosed near-surface grid-square averaged air temperature.
- T2CITY2: Near-surface air temperature representative of the urban (impervious) fraction of the grid square.
- T2RUR: Near-surface air temperature representative of the rural (pervious) fraction of the grid sq