Chicken Creek Watershed Land Use and Land Cover Data
Authors
- Institute for a Sustainable Environment – University of Oregon
Purpose
Land use /land cover datasets developed to explore coming pressures and contrast potential solutions for integrated, urban water management in an urbanizing watershed near Portland, Oregon.
Description
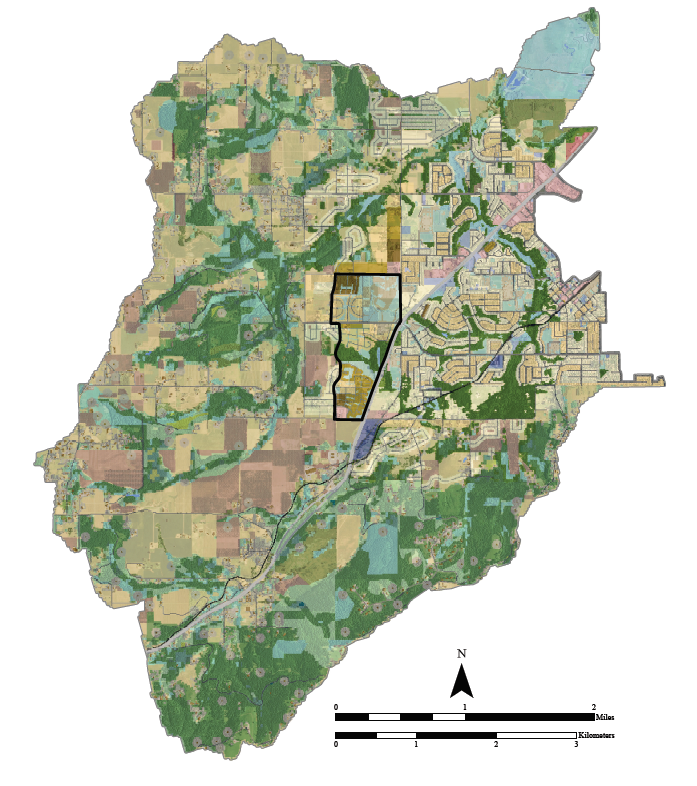
Rasters represent current (2010) and future (2060) land use/land cover under three alternative futures scenarios for the Chicken Creek watershed, a ~4000 hectare urbanizing watershed near Portland, Oregon. Rasters were produced with input from a regional Stakeholder Advisory Group (SAC) convened for the Urban Water Innovation Network project D1-1. During a series of meetings (2015-2018), the SAC developed themes and detailed assumptions for three alternative future scenarios: Current Course (current regulatory regime remains in force), Stressed Resources (water treatment and conveyance infrastructure are stressed), and Integrated Water Future (water quality and quantity are managed at the watershed scale). These land use land cover representations were developed to reflect 2060 conditions under the population growth, climate change and land and water management approach stakeholders selected for the three scenarios. Data are delivered as a raster (grid) with a 10m grid cell size and are in NAD 83, UTM, Zone 10.
Attributes
Attribute descriptions provide a brief overview of data sources and process for development of the land use/land cover map and legend classes for the Current Course 2060 Chicken Creek Watershed. Note that we distinguish territory that is RURAL (i.e. outside ca. 2010 urban reserve) from those that are URBAN (i.e. inside ca. 2010 urban reserve and/or ca. 2010 UGB).
RURAL VEGETATION
Forest (classes 52-61)
The 2060 representation of rural forests combines the ca. 2010 forest classification with Envision watershed modeled results for 2060. Envision can simulate both forest harvesting and forest fires but only disturbance due to harvest is represented in this grid. Envision assigns a single land use or land cover classification value to each IDU. These IDUs are too large to represent reasonably the actual pattern of harvest at a 10m grain, and were subdivided by tax lot boundaries to produce the mapping units for this task.
Based on tax lot size and distance from the Sherwood UGB, we assigned forest classes from the UO_LULC legend to mapping units in a way that maintained the proportionality of areas shown in the 2010 10m representation, while also remaining true to what Envision said was the dominant ca. 2060 forest class for the IDU as a whole. Tax lot based mapping units that were not in forest classes in 2010 were not assigned forest classes in the 2060 representation.
For IDUs to which Envision assigned Vegclass values that correspond to multiple UO_LULC classes, we used the same approach, assigning UO_LULC forest class codes in a way that maintained the proportions observed in the ca. 2010 representation.
Agriculture:
Orchards and Christmas trees (class 92):
An initial identification of orchards and Christmas tree fields produced by Feature Analyst image analysis was edited manually in ArcMap using 2011 NAIP images as the primary source to produce a polygonal coverage. Land cover information from this polygonal coverage was then rasterized in the final 10m grid.
Hay/ Pasture/ Rotation (class 85):
The PNW-ERC ca. 2000 Land Use/ Land Cover served as the starting point for the identification of agricultural classes. The 2011 NAIP served as the primary source of information for the revision of agricultural classes. The time span between the ca. 2000 PNW-ERC data and our ca. 2010 representation and the rotational pattern of Willamette Valley agriculture made it difficult to distinguish details of specific agricultural crops. Class 85 is intended to identify locations that are in agricultural use/ production with recognition that the specific use/ crop may change annually or over the course of a few years.
Hedgerow (class 97)
Hedgerows were identified in the visual inspection of forest and agricultural using the 2011 NAIP.
Rural disturbed vegetation (class 25)
Rural disturbed vegetation was identified as part of visual inspection using the 2011 NAIP to refine the agricultural representation. Examples of this class are areas that appear to be abandoned agricultural fields and vegetation associated with rural residential development.
RURAL BUILT
Roads (classes 19-21)
Road classes were selected from the TeleAtlas line file and buffered to widths matching the widths visible in 2011 NAIP and Google Earth imagery. Road widths were defined to achieve general agreement with aerial photographic dimensions when mapped at 10m resolution.
Railroad (class 18)
State Railway System linework from Oregon Department of Transportation.
Rural Structures (class 16)
New ca. 2060 rural dwellings were added based on a suite of suitability criteria including topographic slope, soil class, distance from roads, and stream protection policies. These new rural dwellings accommodate the estimated 2060 Current Course population not met by the new 2060 urban residential land use in the Urban Reserve. Eighty-four new rural dwellings were added on vacant taxlots with a minimum size of 5 acres.
Rural Structure influence zone (class 17)
From the centroids of the 84 newly added rural dwellings (class 16), circular polygons two acres in area (Rural Structure influence zone – class 17) were created to represent locations in which the influence of human activities on vegetation is likely to be strong and of a different composition than agriculture, for example. This class is relevant primarily to ecological process models.
Rural non-vegetated unknown (class 24)
Rural non-vegetated unknown was identified as part of the visual inspection using the 2011 NAIP in the rural part of the Chicken Creek Watershed. This class was used to identify non- vegetated areas outside of the Rural Structure influence zone (class 17) whose use was ambiguous.
URBAN
Residential, commercial, industrial (classes 1-4; 6 – 8; and 10)
Property class codes from ca. 2011 Washington County taxlot data were used to identify taxlot parcels in residential, mixed commercial/residential, commercial or industrial use within the ca. 2010 Sherwood Urban Growth Boundary. 2010 census block group data were used to distinguish the four residential density classes (classes 1-4). For the ca. 2060 alternative future, two new areas were defined for future residential, commercial, and industrial uses:
1) A neighborhood residential site design was developed for the eastern portion of the Sherwood West urban reserve called the Sherwood Neighborhood Focal Area. The design relied on existing Portland Metro residential density policies and housing types, and included guidance from the Sherwood West Preliminary Concept Plan (February 2016). Approximately 1200 new residential dwelling units were added in the Sherwood Neighborhood Focal Area.
2) Outside of the Focal Area but within the ca. 2010 Urban Reserves contiguous with the Sherwood UGB, additional areas were identified to accommodate the anticipated ca. 2060 urban population not already allocated to the Focal Area. Areas were delineated within the urban reserve that represented each of the four dwelling density classes based on proximity to the Sherwood UGB and to roads. The amount of area added for each of these classes was based on the proportions of each of them as represented in the PNW- ERC Development 2050 scenario for this area, and consistent with METRO policy guidance and 20 year housing demand projections in the Sherwood West Preliminary Concept Plan. Two areas for commercial use and one for industrial use also were delineated. Approximately 2400 new residential dwelling units were added in the Urban Reserve outside of the Sherwood Neighborhood Focal Area, for a total of slightly more than 3600 new housing units added in Current Course ca. 2060 Watershed.
Vacant (class 5)
Property class codes from ca. 2011 Washington County taxlot data were used to identify vacant taxlot parcels. Property class code descriptions including the designation vacant are included in this class (for example Residential land, vacant; Commercial land, vacant).
Urban Civic (classes 12 and 13)
Urban Civic built (class 12) and Urban Civic open space (class 13) were identified in conjunction. This started with identification of taxlots from the ca. 2011 Washington County taxlot data with property class codes indicating civic use (for example schools). Image analysis of the 2011 NAIP using Feature Analyst software combined with LiDAR data for height were used to distinguish Urban Civic built (class 12) from Urban Civic open space (class 13).
Within the Sherwood neighborhood, additional Urban Civic Open (class 13) was defined as part of the neighborhood scale green infrastructure. A proposed high school was incorporated into the Sherwood neighborhood. Built portions of the proposed school grounds are classed as Civic Built (class 12).
Urban Forest (class 50)
The identification of Urban Forest started with image analysis of the 2011 NAIP using Feature Analyst software. This representation was revised with visual inspection of the 2011 NAIP to remove areas that were not part of a continuous forest patch and, where appropriate, reclassify areas identified by Feature Analyst to Flooded Marsh (class 92).
WATER AND FLOODED MARSH (classes 33 and 89)
Water and Flooded Marsh occur in both the Urban and Rural parts of the Chicken Creek Watershed. The 10m resolution of the data do not allow for the representation of the streams and creeks in the watershed. Water (class 33) represents small ponds that were identified during visual inspections of the 2011 NAIP in the process of revising other land use/ land cover classes. Flooded Marsh (class 89) includes the majority of the Tualatin River National Wildlife Refuge and areas associated with riparian forests.