Climate Projections: Water Shortages
Authors
- Mazdak Arabi – Colorado State University
- Hadi Heidari – Colorado State University
- Thomas C. Brown – USDA Forest Service
- Travis Warziniack – USDA Forest Service
Purpose
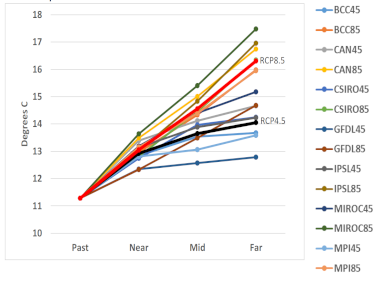
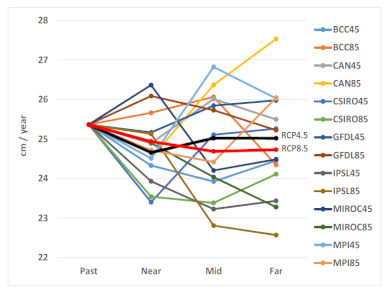
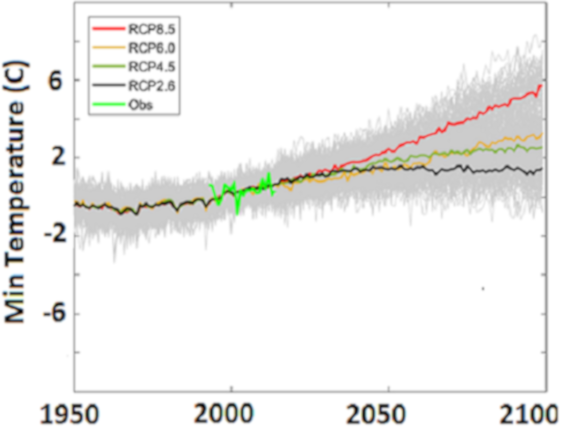
We projected water shortages for climatic futures created by matching two Representative Concentration Pathways (RCPs 4.5 and 8.5) with 5 General Circulation Models (GCMs). The GCM runs selected for providing projections of climatic variables corresponding to the radiative forcing trajectories were generated for the “Fifth Coupled Model Intercomparison Project” (CMIP5).
Description
The MACA archive contains output from 20 global climate models of the Coupled Model Inter-Comparison Project Phase 5 (CMIP5) for the contiguous United States. Downloaded tools provide users with access to projections for historical (observed) forcings from 1950–2005, and for two future Representative Concentration Pathways (RCP 4.5 and RCP8.5) scenarios for 2006–2100. CMIP5 output is downscaled from native resolutions to either 4-km or 6-km using the Multivariate Adaptive Constructed Analogs (MACA) method. MACA is a statistical downscaling method that utilizes a training dataset (i.e., meteorological observations) to remove historical biases and match spatial patterns in climate model output.
A set of projections and present was identified for each RCP scenario to capture a range of future climates – different temperature and precipitation ranges at the conterminous scale – the wettest projection, the hottest projection, the driest projection and the least warm projection, and one projection that reflected a middle of these spectrums. Three criteria were used: 1) identifiy poorer performing models based on historical climate projections 2)restrict selection to only one model from a family of models 3)identify three models representing each spectrum, and if possible, select one model that could represent both RCP 4.5 and the RCP 8.5 scenario. For this assessment, the historical period for comparison with future climate will be 1971-2000. Variables available include mean montly maximum temperature (C), mean monthly minimum temperature, monthly total precipitation (mm), surface downwelling solar radiation (W m-2), potential evapotranspiraton (PET, mm), maximum relative humidity (%), wind speed (at 10 m, , s-1), and near-surface specific humidity.
Climate Model Used
- hadgem2_es365 (Hot)
- mri_cgcm3 (Warm)
- cnrm_cm5 (Wet)
- ipsl_cm5a_mr (Dry)
- noresm1_m (Middle)
Attributes
- tasmax—Maximum daily temperature near surface
- tasmin—Minimum daily temperature near surface
- pr—Average daily precipitation amount at surface